
Hyrax is a powerful, flexible, and extensible framework designed to support the entire cycle of machine learning (ML) projects in astronomy – from data acquisition, model training, inference to latent-space exploration / visualization and much more. Hyrax scales seamlessly from laptops all the way to HPC clusters.
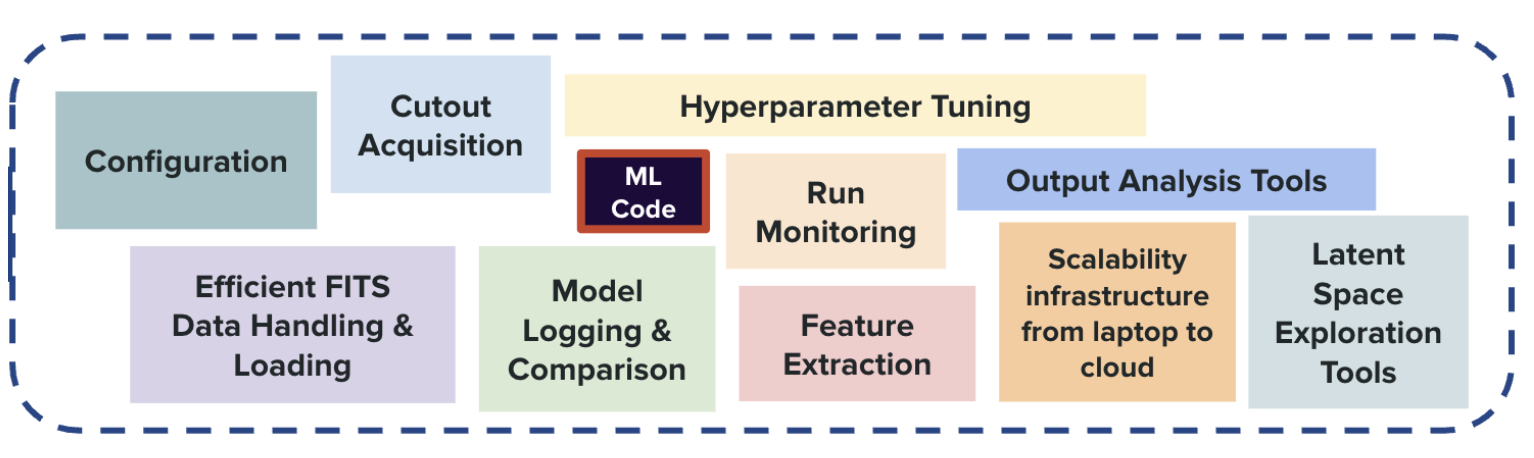
The figure below captures Hyrax’s design principle: we provide all the tools, infrastructure, and software that are necessary for an ML-project in astronomy, so that astronomers can simply focus on choosing/writing the ML model code.
Getting Started
To get started, we recommend creating a virtual environment (e.g., venv or conda)
and then install Hyrax using pip.
>> conda create -n hyrax python=3.12
>> conda activate hyrax
>> pip install hyrax
Note that if you are trying to develop Hyrax, you should alternatively clone the repository and follow the instructions in the Developer Guide.
Once you have Hyrax installed, you can start using it right away! The following example shows how to:-
train a built-in autoencoder
infer on a dataset
create a searchable and relational vector database of inference results
interactively visualize the latent space of the trained model
To train a model in Hyrax, we have to use the train verb.
from hyrax import Hyrax

# Create an instance of the Hyrax object
h = Hyrax()

# Train the default autoencoder model
model = h.train()
>> hyrax train
Without any additional specification, the HyraxAutoencoder model is trained on the CiFAR dataset.
Once the model is trained, we can use the trained model for inference.
# Infer on the CiFAR test dataset
results = h.infer()

# Access inference results directly in your notebook.
results[0]
>> hyrax infer
Hyrax will automatically use the most recently trained model to infer on the CiFAR test dataset.
The results of inference will be 64 element floating point vectors saved as .npy
files in a timestamped directory under the default ./results/ directory, and available in your
notebook via the returned object.
To visualize the results, we should created an embedded lower dimensional space.
# Create a 2D UMAP representation of the 64 element vectors
results = h.umap()

# Access umapped data points directly in your notebook.
results[0]
>> hyrax umap
The UMAP algorithm is used to create a 2D representation of the 64 element vectors. These are saved in the same tree as the inference results, and are similarly available in your notebook via the returned object.
The results of using UMAP can then be examined with an interactive visualization withing a Jupyter notebook.
# Visualize the UMAP results
h.visualize()
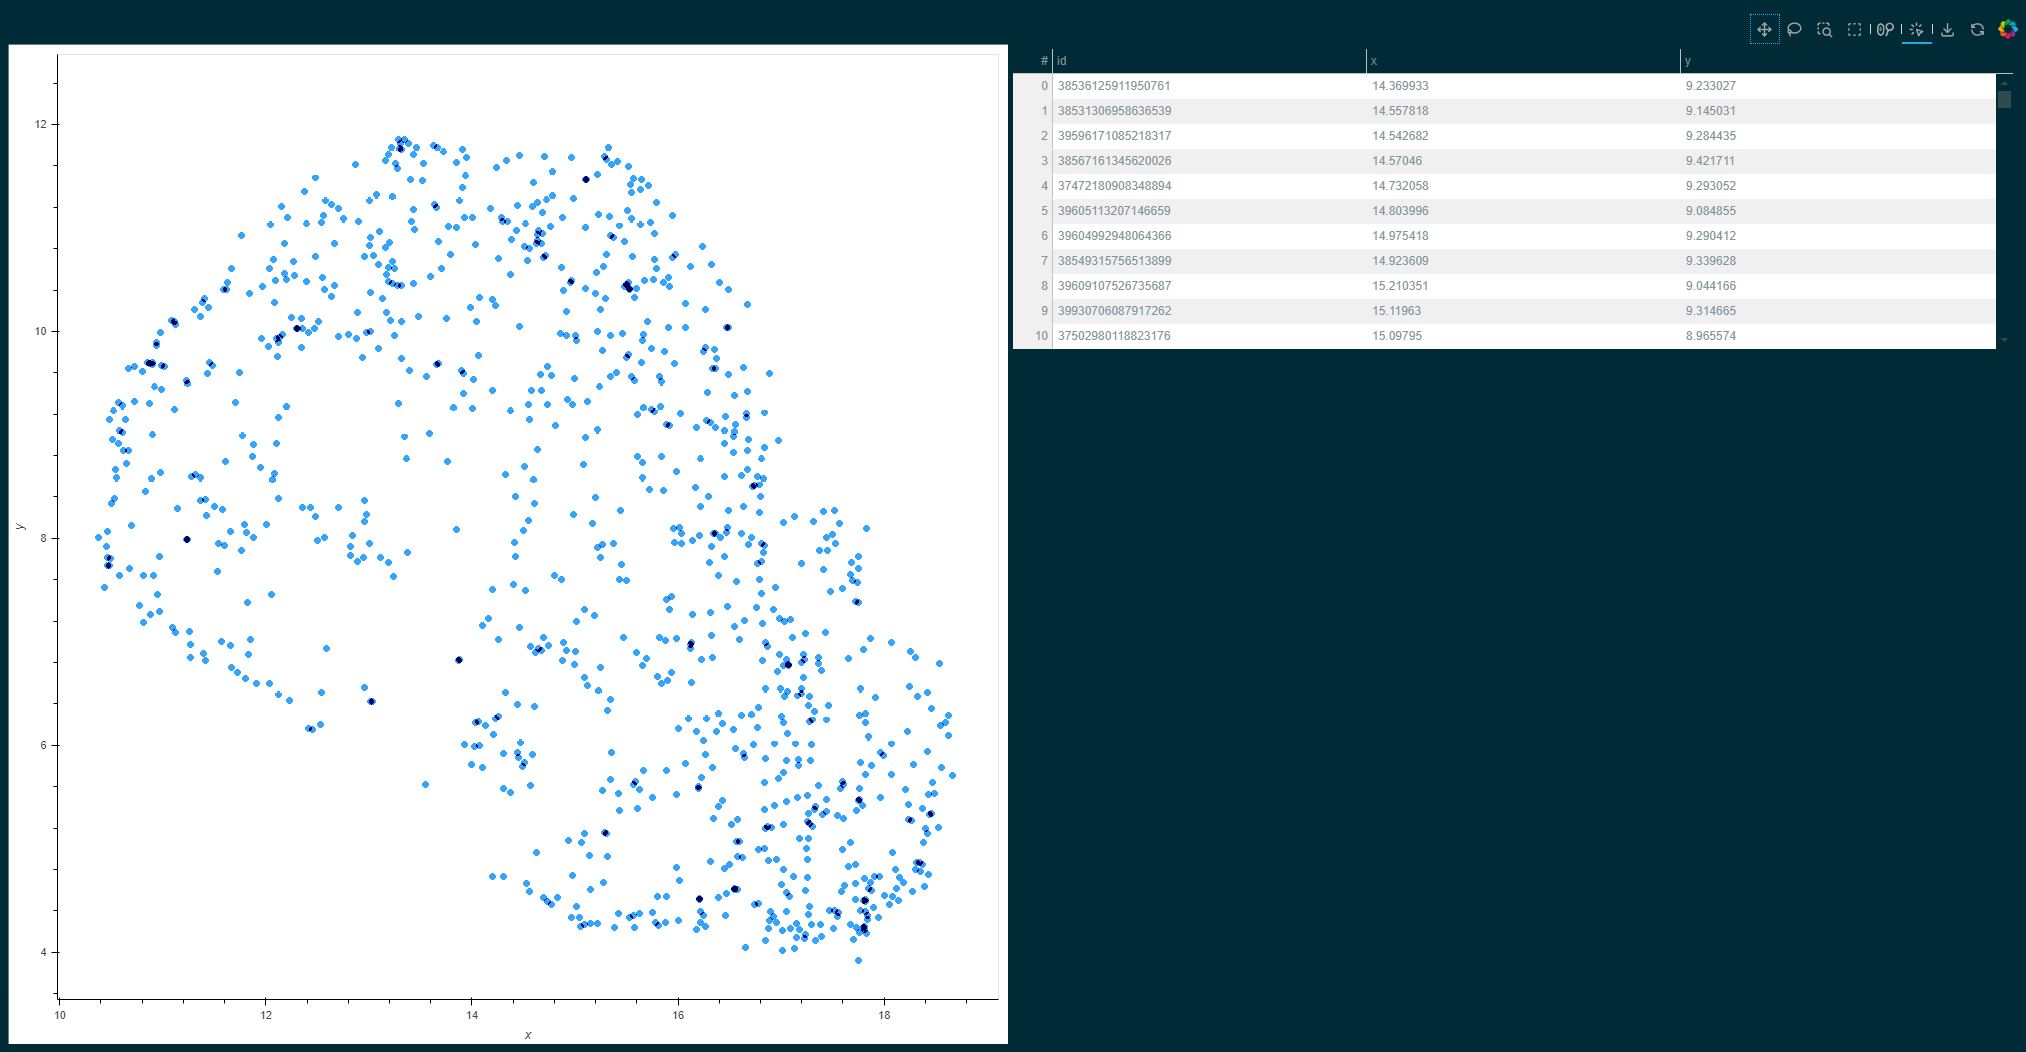
An example UMAP visualization of the CiFAR dataset in a Jupyter notebook.
This example shows how Hyrax can be used to quickly train, infer, and visualize data. Next, we recommend checking out the following sections of the documentation:
Verbs - Description of the various "verbs" that Hyrax supports, such as
train,inferetc.Configuration - How Hyrax can be configured to work with different datasets, models, etc.
Example Notebooks - Example notebooks covering a wide variety of tasks.
For a deeper understanding of Hyrax, you can further explore the following resources:
About Hyrax - Overview of Hyrax’s design principles and goals.
Builtin Datasets - Different datasets that come pre-built within Hyrax.
Custom Datasets and Models - How to create your own dataset class and model within Hyrax.
Data Set Splits - Deep dive into how Hyrax handles data set splits.
Model Comparison - Tools available in Hyrax for model tracking and comparison.
Developer Guide - How to install Hyrax from source with additional developer tools.
API Reference - Detailed API reference for Hyrax.